Most owners can list their team. Very few can draw a chart where each seat has one name and one clear set of accountabilities.
The Accountability Chart comes from Gino Wickman’s Traction, the book that introduced the EOS framework. Of all the tools in the system, this is the one most owners avoid — because it surfaces the hardest conversations about who really owns what.
On this page
- What is the EOS Accountability Chart?
- Accountability Chart vs org chart
- The 3 questions every seat must answer
- The 8 boxes — a simple starting framework
- How to build your Accountability Chart
- How it works with the Level 10 meeting
- Watch: Ben Stickland builds one in practice
- Common mistakes to avoid
- Where SYSTEMology fits
- FAQ
Short answer: The EOS Accountability Chart is a one-page diagram that defines every seat in your business by its accountability — not by who currently sits in it. It replaces the traditional org chart. Each seat has 3–5 clear accountabilities, one name against it, and passes the GWC test (Get it, Want it, Capacity). Used with Gino Wickman’s EOS framework, it’s the tool that turns a fuzzy team structure into a business that can actually be run, sold, or inherited.
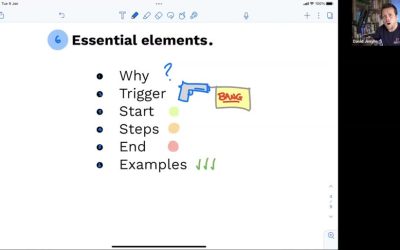
EOS Implementer Daniel Davis walks through the Traction system. Accountability chart section picks up from ~06:44.
What is the EOS Accountability Chart?
Most business owners draw a hierarchy. Boss at the top, managers underneath, team under them. It looks tidy. It’s useless.
An org chart shows who reports to whom. An Accountability Chart shows who is responsible for what. They sound similar. They’re not. One describes your reporting politics; the other describes how your business actually works.
In Gino Wickman’s Traction, the Accountability Chart is the People component tool. It forces you to answer three questions most owners have quietly avoided for years:
- What are the key functions my business genuinely needs to run?
- Who owns each one — as in, solely accountable for it?
- Is the right person actually in that seat?
Those questions sound basic. They’re not. A lot of owners can list their team. Very few can draw a chart where each seat has exactly one name and exactly one set of clear accountabilities. When you try, all the fuzzy handoffs and double-hatted roles come screaming out.
That’s the point.
Accountability Chart vs org chart
It’s worth being specific about the difference, because people often treat them as the same diagram with different labels. They’re not.
| Traditional org chart | EOS Accountability Chart |
|---|---|
| Shows reporting lines | Shows ownership of accountabilities |
| People at the top, people at the bottom | Functions in boxes, people in seats |
| Hierarchy + status | Clarity + responsibility |
| Grows with headcount | Stays flat — max 2 levels |
| Titles in every box | Accountabilities in every box |
| Updated when someone joins or leaves | Reviewed quarterly at offsite |
| Answers: who’s my boss? | Answers: who owns this? |
You can keep your org chart if you like. But don’t confuse one for the other. The Accountability Chart is a leadership tool; the org chart is an HR artefact.
The 3 questions every seat must answer
Before you put a single name on the page, every seat needs to pass three tests. This is the part people rush. Don’t.
Is the seat genuinely unique?
No two seats should share an accountability. If “owning the sales pipeline” shows up in two boxes, one of them is wrong. Overlap is how accountability dies.
Does it have 3–5 clear accountabilities?
Not 15. Not two. Three to five. Fewer means the seat isn’t substantial enough to exist. More means you’re really looking at two seats crammed into one box, which is how you end up with an Operations seat that silently owns hiring, legal, and supplier contracts.
Can one person own it?
If you genuinely need two people to cover the accountabilities of a single seat, it’s two seats. This is the single most common mistake. “Co-heads of marketing” almost always means one of them actually owns demand gen and the other owns brand — two seats, clarified.
The 8 boxes — a simple starting framework
There’s no sacred list of seats every business must have. But the majority of $1M–$15M businesses land somewhere close to this 8-box structure when they’re done.
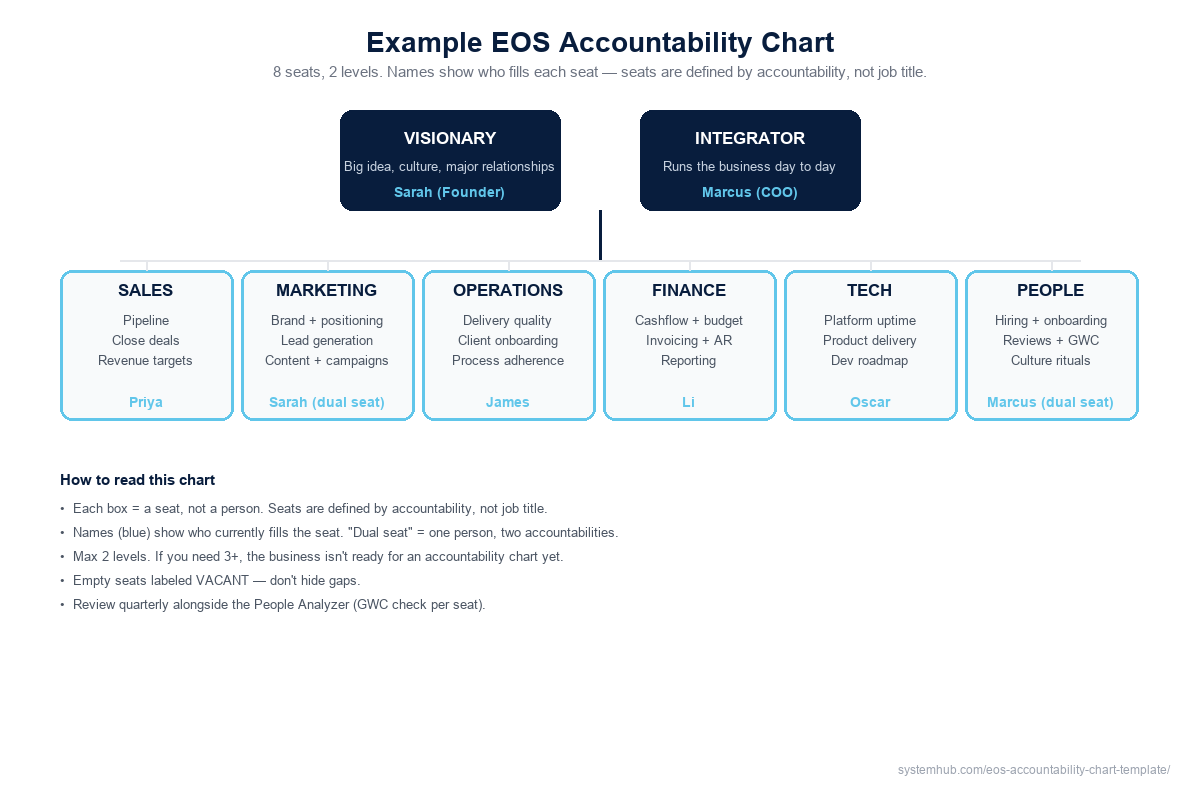
Example 8-seat Accountability Chart. Names show who fills each seat. “Dual seat” = one person, two accountabilities.
- Visionary. The big idea, company culture, and major relationships. Often the founder. Works on the business, not in it.
- Integrator. The person who runs the business day to day. Holds the leadership team accountable. Often a COO, GM or second-in-command.
- Sales. Pipeline, conversion, deal-closing, revenue targets.
- Marketing. Brand, positioning, lead generation, content.
- Operations. Delivery quality, client onboarding, process adherence.
- Finance. Cashflow, budget, reporting, invoicing.
- Tech (or Delivery). Platform, product, uptime — whatever your core output is.
- People (HR). Hiring, onboarding, quarterly reviews, culture rituals.
In smaller businesses, one person often owns multiple seats. That’s fine. The Founder might be Visionary + Marketing for a while. What’s not fine is leaving accountabilities undefined because “we all pitch in”. That’s a business running on goodwill, which eventually runs out.
Real example: Jamie at Absolute Immigration ran a high-stakes professional-services firm where every case required meticulous accuracy. When he mapped out the seats properly — who owned the client journey, who owned compliance, who owned delivery — he could step out of day-to-day casework for the first time in years. The chart didn’t change who was on his team. It changed what each of them was accountable for, and suddenly the business could run without him holding every thread.
“We’ve decided what the key roles are and we’ve decided who owns them. And the people who own the key roles in your business are your leadership team. If they don’t own a key role, they don’t get to be on your leadership team. It’s just that simple.”
— Ben Stickland, on the foundational move of building a leadership team around an Accountability Chart
How to build your Accountability Chart (step-by-step)
The offsite that builds the first draft usually runs 90 minutes. Here’s the flow that works:
- Start with the 8 boxes. Don’t invent your own. The default set is battle-tested. You can modify later.
- For each box, write 3–5 accountabilities. Use action phrases, not job titles. “Owns the sales pipeline + closes enterprise deals + hits quarterly revenue target” beats “Sales Manager”.
- Put names in the boxes. Some people will own more than one seat. Write it as “Marcus (dual seat)” so it’s clear. If a seat is empty, write VACANT — don’t pretend someone owns it.
- Check for overlap. Go through every accountability. If two seats reference the same thing, one of them is wrong.
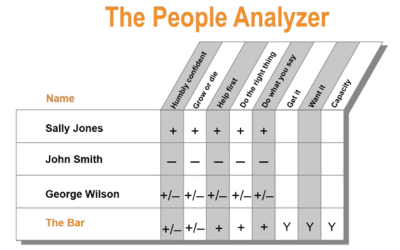
- Check GWC for each seat-holder. Does this person Get it, Want it, and have Capacity for this seat? A No on any of the three means wrong person in right seat, or right person in wrong seat.
- Schedule the next review. Quarterly, same week as your People Analyzer session. The chart is dynamic — businesses and people move.
How the Accountability Chart works with the Level 10 meeting
The chart isn’t a document that lives in a drawer. It’s the scaffolding for the entire EOS leadership rhythm.
- Your leadership team is literally the names on your Accountability Chart — the seat-owners, no one else.
- Your weekly Level 10 meeting is attended by those people. Anyone who doesn’t own a seat isn’t in the meeting.
- Your scorecard tracks numbers against seats (one accountable owner per metric).
- Your rocks (90-day priorities) are assigned to seat-owners.
- Your People Analyzer runs quarterly against the chart.
Without the chart, the L10 becomes a status update with too many attendees. With it, every agenda item has a clear owner and a clear place to land.
Watch: Ben Stickland builds one in practice
Daniel Davis walks through the theory at the top of this page. For the practitioner view, here’s Ben Stickland — founder of an Australian tech firm running an EOS-style operation — walking through exactly how he built the leadership team and Accountability Chart for his business. He also covers where he got it wrong the first time, which is arguably more useful.
Jump points: leadership team definition at 8:02, “the eight boxes” at 10:55, core values at 15:00, weekly meeting + rock review from 35:30.
Listen to the full conversations
Want more context? Ben Stickland’s full episode covers the complete management and leadership system. Daniel Davis’s episode walks through the full EOS framework for small business.
Common mistakes to avoid
The chart looks simple. It isn’t. Here’s where most first drafts go wrong.
- Names first, seats second. If you start with your current team and build the chart around them, you’ll design a chart that fits the people you have — not the business you’re trying to build. Seats first. Always.
- Hiding the gaps. If a seat is vacant or under-filled, say so. The chart is useless as a planning tool if every seat shows a name you’ve quietly decided is “good enough for now”.
- Three-plus levels deep. If your chart has three levels of boxes, you’re drawing an org chart again. Leadership team lives at Level 1 + Level 2. Deeper hierarchies (tech leads, department supervisors) get their own Accountability Charts one level down.
- Too many boxes. Anything over 10 leadership seats means you’ve confused sub-functions with top-level seats. Fold them back up.
- Treating it as static. The chart gets reviewed every quarter. Seats shift as the business grows. A chart from 18 months ago is usually wrong.
- Skipping the GWC check. Designing the chart but never checking whether the people in the seats fit them. That’s how dysfunction calcifies.
Where SYSTEMology fits with the Accountability Chart
The Accountability Chart tells you what the seats are. It does not tell you how any of them work.
That’s the gap SYSTEMology fills. Once a seat exists on the chart, the natural next question is: what are the repeatable processes this seat performs, and are they documented? A seat with strong SOP documentation is a seat the next person can fill in days instead of months. A seat without it dies with the person.
Plenty of EOS businesses run SYSTEMology underneath their Traction rhythm for exactly this reason — the leadership clarity comes from EOS, the operational depth comes from SYSTEMology. For a deeper walkthrough of the two frameworks side by side, see SYSTEMology vs EOS: Why the best operators run both.
Turn your Accountability Chart into a systemised business
Drafting the chart is the first hour’s work. The real job is what comes next: documenting the repeatable processes behind each seat so the seat stops depending on the person in it. That’s the work systemHUB is built for — SOPs, AI-assisted process capture, and a home for every playbook behind every seat on your chart.
Prefer the canonical EOS version of the Accountability Chart template? It’s free in Gino Wickman’s EOS Toolbox.
Accountability Chart FAQ
What is an EOS Accountability Chart?
The EOS Accountability Chart is a one-page diagram from Gino Wickman’s Traction that defines every seat in a business by its accountability (not by who currently sits in it). Each seat has 3–5 clear accountabilities, one name against it, and passes the GWC (Get it, Want it, Capacity) test.
What’s the difference between an Accountability Chart and an org chart?
An org chart shows reporting lines — who reports to whom. An Accountability Chart shows ownership — who is accountable for what. They sound similar but answer different questions. The org chart answers “who’s my boss?”; the Accountability Chart answers “who owns this outcome?”.
How many seats should my Accountability Chart have?
Most businesses under $15M land with 8–10 top-level seats. Over 10 usually means you’ve confused sub-functions with leadership seats. Under 6 usually means you’ve left accountabilities undefined or multiple ones packed into a single box.
What if one person owns multiple seats?
Fine — it’s common in smaller businesses. The Founder often owns Visionary + Marketing for years. Write it clearly on the chart as “dual seat”. What matters is that the accountabilities are still specific and separate — you’re tracking two distinct areas of ownership that one person happens to run today.
Can two people share one seat?
No. If the seat genuinely requires two people, it’s two seats. “Co-heads of marketing” almost always breaks down into one person accountable for demand generation and another accountable for brand — two seats with their own accountabilities and their own names.
How often should we update the Accountability Chart?
Quarterly, alongside your People Analyzer session. Seats shift as the business grows. Names shift as people grow into or out of seats. A chart from 12–18 months ago is usually wrong in at least two places.
Where can I download a free Accountability Chart template?
The canonical free version is inside Gino Wickman’s EOS Toolbox at eosworldwide.com/eos-toolbox. It includes the Accountability Chart, Level 10 meeting agenda, People Analyzer, VTO and scorecard templates.
What’s the difference between an Accountability Chart and a RACI matrix?
A RACI matrix maps individual tasks to responsible / accountable / consulted / informed roles. An Accountability Chart operates at the leadership-team level and defines ownership of whole functions, not tasks. A business can have both: the Accountability Chart shows who owns each function; a RACI (if you choose to use one) shows how individual processes flow across those seats.
Do I need the Accountability Chart if I’m not running full EOS?
Yes. The Accountability Chart is useful with or without the rest of EOS. It’s the clearest tool for answering “who actually owns what in my business?” — and that question matters whether you’re using EOS, Scaling Up, SYSTEMology, or none of the above.